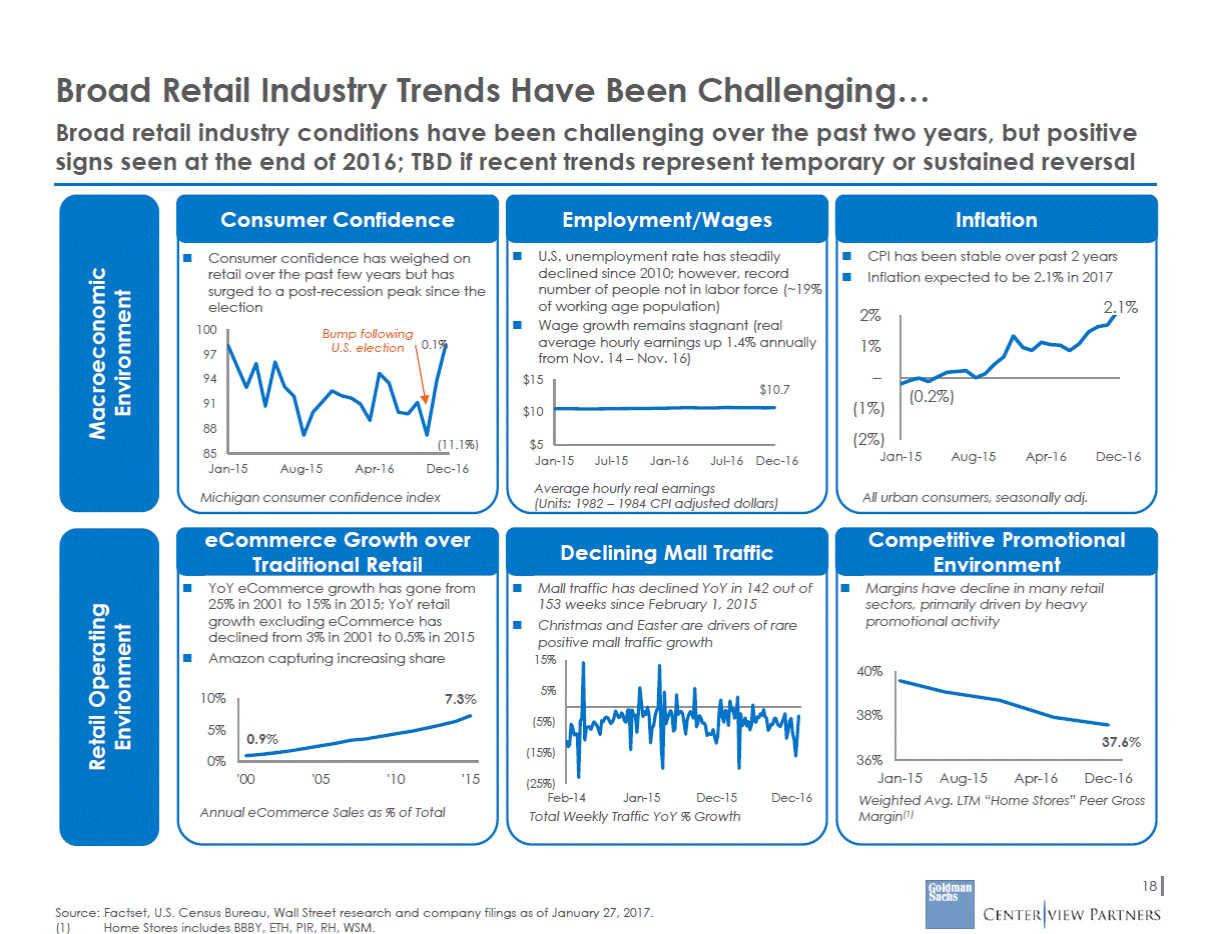
Financial analysts constantly use information from other people's presentations all around the web including public and private information. We all do. But what’s different is they are using more charts, more tables, more everything. Investment bankers are paid to collate all of the evidence/data available about the COMPANY and the MARKET into a cohesive presentation that consistently backs up their insightful/well researched/detailed recommendation.
Pitch decks are dreaded by analysts: they’d rather work on “live deals” as they’ll a) get them farther in their career and b) be substantial enough to put on their resumes. But what about pitch decks? They are not only often seen as thankless work by Analysts, but they are also annoying. They are where a ton of the formatting work is required – the not so glamorous piece mentioned in the headline!
Investment banks are constantly putting together pitch decks to maintain momentum in client relationships. The 2% free they make on the transaction doesn’t always come all that easy. The bankers have to hang around the hoop and provide incredible insight and customer service for free while waiting for their fee. Big companies like Johnson & Johnson are constantly receiving pitch decks from investment banks advising them on all of the things they can do to maximize shareholder value.
The main point though is to come back to the work that goes into a pitch deck. Pitch decks take A LOT of time, and are composed of a lot of boilerplate. The truth is, a lot of the foundation needs to simply exist in Presentation format “just in case” – so you are always seen as the expert. After all, these people are paid to be the experts. Then, the banker gets to the meeting, and in a classic sales fashion doesn’t even go through the presentation.
Pitchbooks can be 50 - 70 page presentations. A lot of graphics come from that the public company filings (10-Ks, 10Q-s, Investor Presentations) and they're being recreated by the investment bankers not only that but if we take something like public comparables they have to include information about the public markets and who is operating in the same sector and who your peers are in order to make a an evaluation that makes sense about what your business is worth. For example, an investment banker pitching to an Industrials company (the sector I used to cover) will look at the peers in the same space – tiering their peers if possible to present a blending multiple to inform the company on their valuation and highlight their financial scorecard and options. This is basically standard practice.
One time I completed an entire 70 page pitch book myself (with no Associate checking over my work) for basically a meeting that was expected to go nowhere. That part was telegraphed to me in advance. I was staffed on the account and this was a tangential presentation with low expected value for the firm. Those are the most demoralizing. To make it up to me, the Managing Director took me the meeting at Warburg Pincus where he did the presentation. It was just me and the MD which was "pretty cool" -- it turns out what counts as cool when you are 21 and just out of college is totally different than what you feel when you hit 30. Ha. I just remember all of the pages that were never touched that took me a ton of time. Everyone in finance has those moments.
Let's take a classic situation: you are comparing companies. You are searching for "Revenue by End Market" (I've done this search hundreds of times). Let's say you get lucky and there's the exact pie chart you need in a recent Investor Presentation. What happens right now is:
You take a screenshot of the pie chart
They move that picture over into Excel and then
Then you recreate the entire chart and change it to your company colors. In the case of most banks, this means different shades of blue! Yeah! Haha.
Next, you use either a plugin to sync the data over to a PPT or you move the chart directly into the PowerPoint
This process is basically rinse and repeat. Meanwhile, you know in the back of your mind that Senior management is wondering: what's taking you so long on that simple page I asked for days ago!
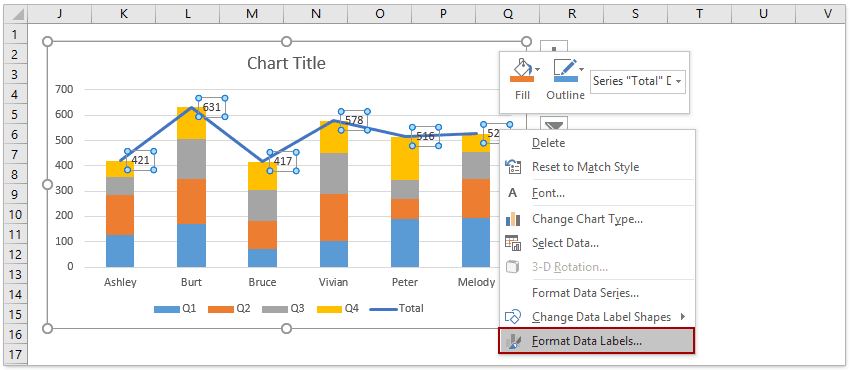
Let's take another example on where chart creation adds up. Small things like adding totals to a stacked bar chart require 5 steps: https://www.extendoffice.com/documents/excel/1334-excel-add-total-to-stacked-bar-chart.html:
You first have to add the total row
Then create a line chart
Then add data labels
Then change the label positioning
Then remove the line

In conversation with a friend now at a top-tier Private Equity firm, he mentioned that it's the small things that add up and make you "great" -- most people in finance come to the conclusion that not everything is rocket science. It is, however, about speed and how quickly you can move. The ability to create charts faster, then, becomes an important part of your speed toolkit.
This process is super repetitive, annoying…. all of the things! It's a giant waste of time. It didn’t strike me that there could be a better way until a few years ago. This is just one of the big areas for workflow improvement for finance professionals that exists. There are plenty more as well.
So the question then is: why does it take a boatload of work to simply re-create a chart in 2022?
About the Author
Founder at Gridlines


