In the following I’ll explore the tools used by the majority of investment bankers. This list comes from recently interviewing ten different investment bankers at companies such as Credit Suisse, Perella Weinberg Partners, Natixis, and Capstone Partners. It also comes from my experience as an Investment Banking Analyst at Barclays.
Before diving into the software, it’s important to note on the hardware side that most bankers work with Windows computers. The shortcuts for Microsoft Excel have always been top-of-mind on Windows computers vs Macs which come with Apple’s Sheets desktop application installed. Nobody uses Sheets in the industry.
Now, when talking to bankers here is what they are typically using day-to-day:
Here’s the list:
For company data:
CapitalIQ
FactSet
Pitchbook
Bloomberg
For industry research
Equity research reports
Consulting research
IBIS
For excel shortcuts
CapIQ
FactSet
Macabus
Microsoft Office Suite
PPT, Excel, PDF, Word
Outlook for email and calendar
For graphics and data collection:
ILovePDF.com
Snipping tool, Microsoft Paint, and SnagIt
Adobe PDF Reader
Their graphics team
An offshore team
Other:
Dropbox
Virtual data rooms like intralinks
BamSEC (acquired by Tegus)
Grammarly
Salesforce
Getting data for private and public companies
Bankers use a combination of CapitalIQ and FactSet to get data. In my day, CapitalIQ was known to be better for getting private company data while FactSet was better at public company data. Depending on if your bank pays for them, you can also access Equity Research reports including equity research analyst ratings and write-ups on different public stocks.
The nice thing about these products is that they line up data over the years, which is what analysts need. If you look at a traditional 10-K or 10-Q (the “source of truth” for all of these numbers) – the issue with these original documents has always been that you have to pop open 10 files to piece together the actual numbers for a company over the last five years, for example. Three or five years of past financial data is often required when building out models. You need past data to look at revenue growth rates and margins for example, which you have to project into the future.
There’s also Pitchbook, which has great data for earlier-stage companies. Venture capitalists use Pitchbook probably as a more primary source of data. It goes into the different funding rounds and the investors at each stage.
The elephant in the room is Bloomberg. This is used by product group bankers, whereas FactSet and CapIQ are used by coverage group bankers. Bloomberg terminals are notoriously expensive. Bankers working on M&A in coverage groups will use them if that acquisition involves some debt financing and they need to look up the current LIBOR rate or look at the yield curve. On the other hand bankers in equity capital markets or debt capital markets use Bloomberg all day long. They are still putting together presentations for clients but they also help execute the actual transactions in real-time. Whereas coverage groups play more of an advisory role either representing clients on the buyside or sellside of an M&A deal. They also help companies draft prospectuses to file to IPO, and advise around other shareholder value creation strategies.
Industry research
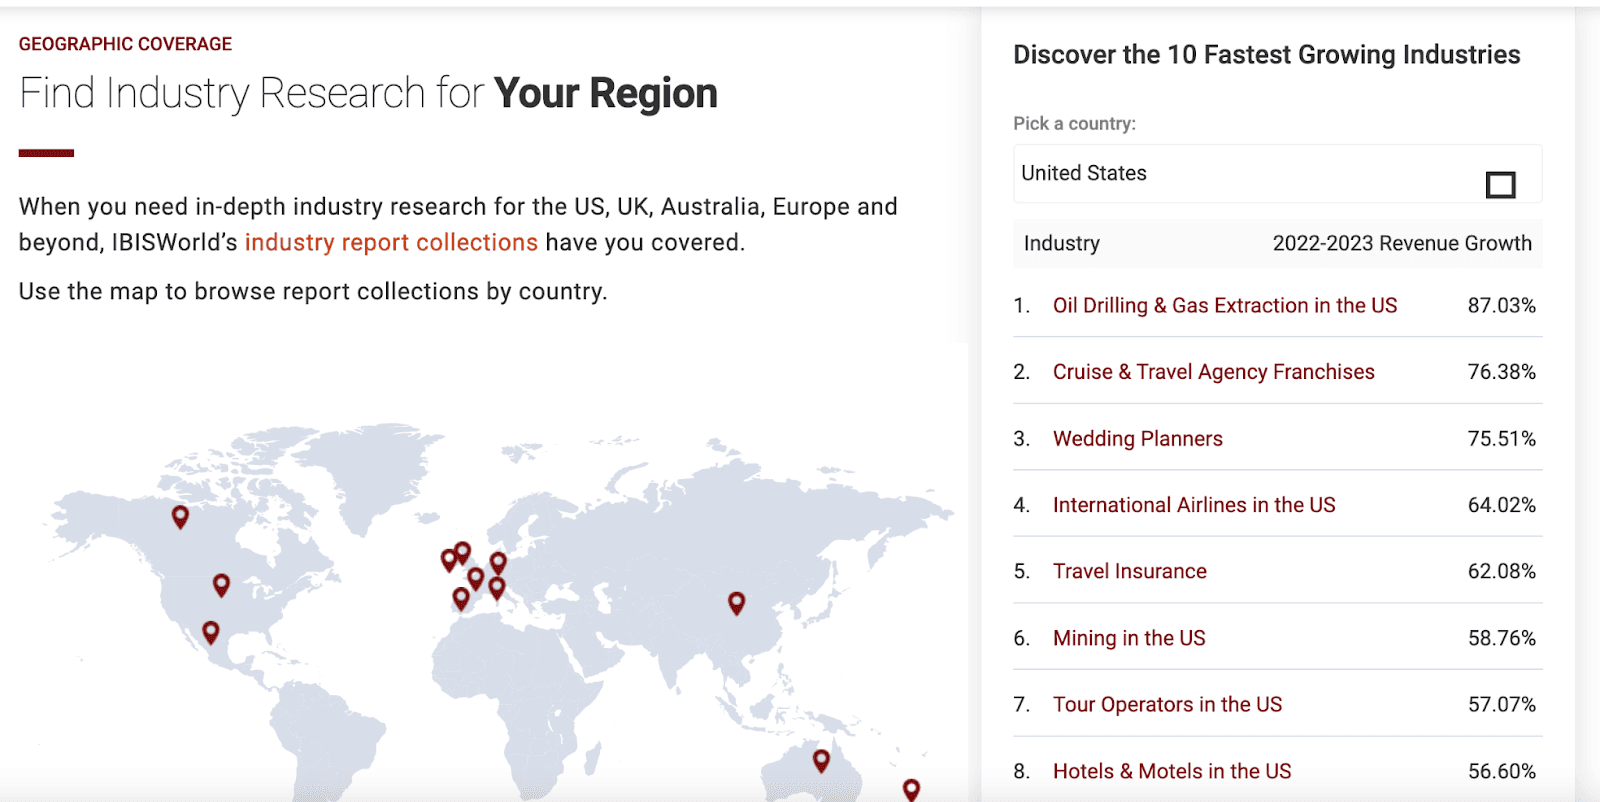
Research reports are really helpful when it comes to laying out the current state of a certain industry. Industry research can get expensive. As such, investment bankers are constantly scouring the web for research reports with market sizing graphs that are free. However, in an effort to lure you into buying the report, the publishers often only release a few pages or charts missing the actual backup data.

Source: IBIS World website.
Excel shortcuts software
Macabus provides an excel shortcut plug-in apparently. It would be impossible for bankers to work without basic plug-ins that reformat their Excel spreadsheets. A “must have” plug-in changes the colors of the cells as you type. For instance cells that contain constants are colored blue, cells that link to other sheets are green, formulas are black, and so on. There are a few big colors that matter and these help you read the file to understand the mechanics behind how the numbers flow. Two other big plug-in use cases: (1) the ability to “walk through” more than one cell at a time is really useful and (2) syncing data and auto-refreshing between PPT and Excel.
As a company I thought Macabus was more widely known for their training tutorials, but maybe that is part of their content marketing. For example, if you’re studying for private equity interviews you’ll see the class Macabus Paper LBO. They also release LBO templates and other materials. If you work in IB you likely are not using these. But when you leave IB these are great reference materials to remember how things are done.
Microsoft Office Suite and essentials
Life simply could not go on without it. Most of the day is spent shuffling between Excel and PPT…and taking data online and re-framing it to support narratives for upcoming presentations.
Bankers typically use Outlook for emails and calendars. Plenty of time is spent on calendar coordination to schedule meetings.
The other essentials would be cloud storage – they often use Dropbox or Box for this. Then for Managing Directors who need to maintain relationships, they might use Salesforce. I didn’t personally use Salesforce as an Analyst ever but I did see MD’s with it popped open here and there.
Graphics
Investment banking groups usually have graphics assistance that comes in two forms: a graphics professional on the same floor as the team that can turn around presentations quickly. They also have a book binding floor. When you need pitch books printed you send it to a special email and the book is professionally bound. This is only done one time when the book is deemed final. The graphics professional can take a few days to turn around your request depending on the queue of other requests. Usually you submit a request for help by sending over a PPT with screenshots of what you need, and then the graphics person will convert those over for you into real charts and your company colors. You get back that page live a few days later. Sometimes it’s weeks later. It just depends. There’s also an offshore team that can help with industry research and basic data requests. That team in particular you’ll want to link back to all of the sources they are referencing because it’s your job as an analyst to make sure they are accurate.
If you ask an investment banker to describe their software stack, tools to grab images would probably be overlooked since they are so native to their workflow. The most widely utilized tool - the Windows Snip tool (shown below) - comes pre-downloaded on Windows computers. Usually, bankers will take a screenshot with this tool and then move that into Microsoft Paint if they need to add additional context.
Other
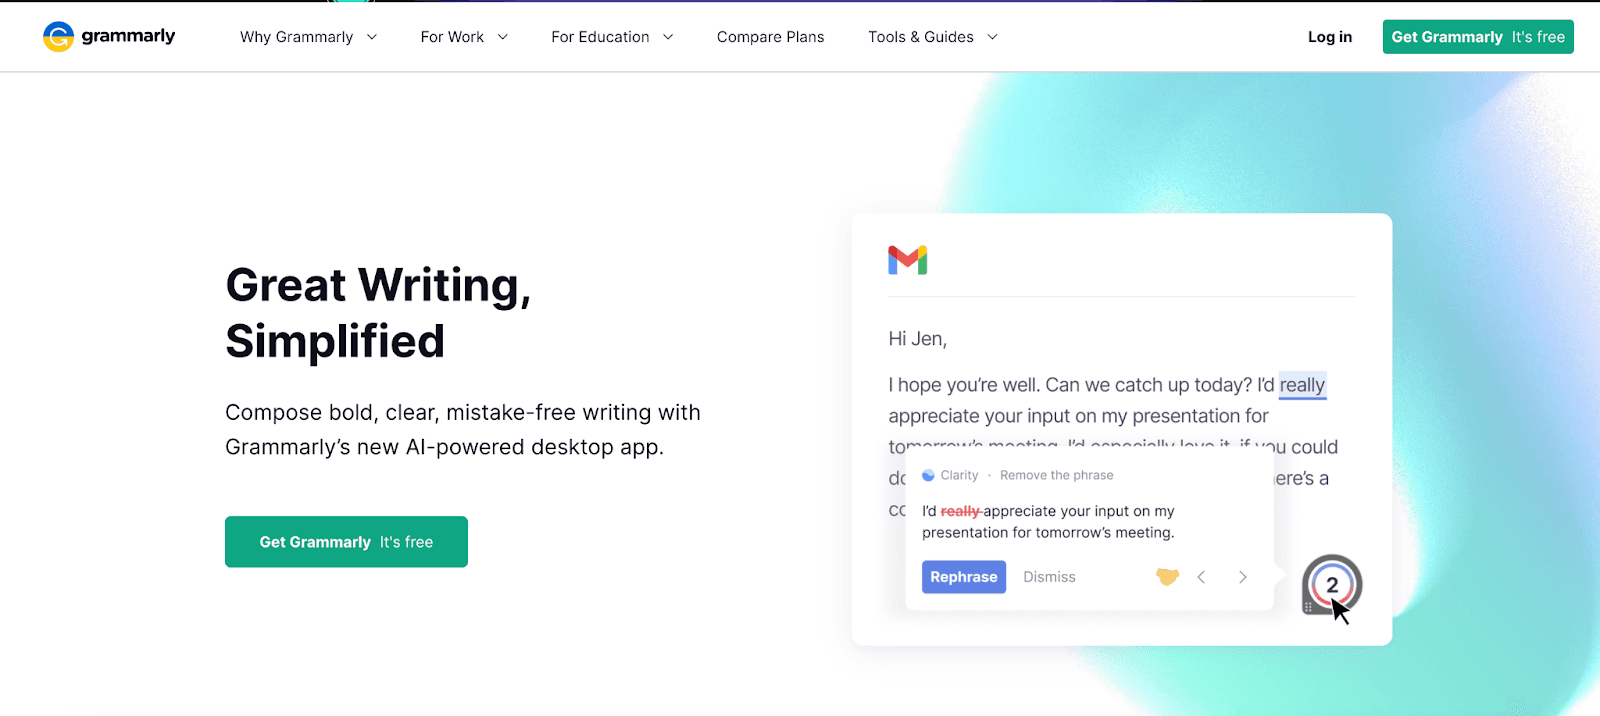
Maybe surprisingly, Grammarly has come up as a timesaver for analysts. It spell checks your writing and makes recommendations.

BamSEC is software that organizes public company documents efficiently. Analysts frequently use it to highlight text and directly link to exact numbers to save those as comments in excel and make it easy to get back to the exact place in the document where they found the number later on. This also makes it easy for team members to see where the number originated from. It was recently acquired by Tegus, a Chicago-based company that raised a $90M Series B and invented a new type of platform for customer interviews. Tegus itself is more widely used by Private Equity and Hedge Fund folks than it is by investment bankers, would be my guess.
Reliability matters.
Most of these software providers have been around for decades. The common reason people stop using technology that kept coming up in conversations was reliability. For example, if CapIQ shortcuts do not work consistently, then people stop using it altogether.
In Investment Banking, making sure that your numbers “tie out” across your presentation is central. You could do weeks of great work and then have two numbers that don’t match and that ruins your reputation as an Analyst. In fact, this is so much so the case that it’s recommended to print out your presentation and go through and highlight all of the numbers that should match before turning in your final book. After all, you’ve spent *so much time* looking at the numbers, but you may have changed one thing at the end that causes a discrepancy. Since accuracy needs to be at 100%, it’s no wonder that reliability matters so much.
About the Author
Founder at Gridlines


